← Back to the plain-language case
Abstract's CI and p-value for the coprimary fatigue score match a secondary endpoint, not the Results
Neurology (2023) · doi:10.1212/WNL.0000000000207402 · PMC10382259
Summary
The abstract reports the between-group difference on the coprimary PMMSA total fatigue score (TFS) as −0.07 (95% CI −0.10 to 0.26; p = 0.37). The Results give the same estimate with a 95% CI of −0.69 to 0.54 and p = 0.81, and those values follow from the arm LS means and SEs printed next to them (SE of the difference 0.311, which gives a 95% CI of −0.69 to 0.53 and p = 0.80). The abstract interval is centred on +0.08, not on −0.07. Its CI and p-value are identical to those the supplementary eTable 1 gives for a secondary endpoint, the PMMSA Most Bothersome Symptom score (0.08; −0.10 to 0.26; p 0.37). The trial is negative under either version, but the abstract's interval is 3.4 times narrower than the correct one. It would rule out any fatigue benefit larger than 0.10 points, whereas the paper's data are compatible with a benefit of up to 0.69 points.
What the paper reports
All quotations are from the article as archived in PubMed Central. The publisher's typeset PDF gives the same numbers, with true minus signs.
Abstract, Results paragraph:
Between the participants receiving elamipretide and those receiving placebo, the difference in the least squares mean (SE) from baseline to week 24 on distance walked on the 6MWT was -3.2 (95% CI -18.7 to 12.3; p = 0.69) meters, and on the PMMSA, the total fatigue score was -0.07 (95% CI -0.10 to 0.26; p = 0.37).
Results, "Primary Endpoints of Overall ITT", second paragraph:
The LS mean (SE) of change from baseline to week 24 on the PMMSA TFS was -1.13 (±0.22) for participants receiving elamipretide and -1.05 (±0.22) for participants receiving placebo, a -0.07 difference between the 2 groups (95% CI -0.69 to 0.54; p = 0.81) (Figure 2B). The PP participant analysis demonstrated a 0.09 difference between the 2 groups (95% CI -0.54 to 0.72; p = 0.78).
Methods, "Efficacy Assessments", which defines the endpoint:
Coprimary endpoints evaluated the effect of elamipretide for 24 weeks including the distance walked (in meters) on the 6MWT and the total fatigue score on the Primary Mitochondrial Myopathy Symptom Assessment (PMMSA), previously described in detail.
Methods, "Statistical Analysis", which describes the model:
Analyses of continuous endpoints were conducted using a mixed-model repeated measures approach, with fixed effects for treatment, visit, the treatment-by-visit interaction, and participant as a random effect.
Results, which points to the supplement:
Secondary endpoint results are summarized in eTable 1 (links.lww.com/WNL/C852).
Supplementary eTable 1, "Secondary Endpoints Results at Week 24", first row (transcribed from the one-page PDF):
| PMMSA Most Bothersome Symptom Score | Elamipretide 40 mg (n = 98) | Placebo (n = 101) |
|---|---|---|
| LS Mean (SE) | ‒0.21 (±0.06) | –0.29 (+0.06) |
| LSM Diff (95% CI) | 0.08 (‒0.10, 0.26) | |
| p-value | 0.37 |
What the paper's own numbers show
Method. The paper reports MMRM estimates. Without the model's covariance matrix, I approximated the SE of each between-group difference as √(SE₁² + SE₂²) from the two arms' LS-mean SEs, since the arms are independent. I then formed Wald 95% intervals (±1.96 SE) and two-sided p-values. For each interval the paper prints, I also worked backwards: a symmetric Wald interval has its estimate at the midpoint and an SE of (upper − lower)/3.92. Using a t reference with about 200 df instead of z changes nothing at two decimals. Every number below is printed by recompute.py.txt.
| Quantity | Location | Reported | Recomputed |
|---|---|---|---|
| TFS difference, elamipretide − placebo | Results, ITT para 2 | −0.07 | −0.08 from −1.13 − (−1.05); CI midpoint −0.075 |
| SE of the TFS difference | Results, ITT para 2 | arm SEs 0.22 and 0.22 | 0.311 from the arms; 0.314 implied by the Results CI |
| TFS 95% CI | Results, ITT para 2 | −0.69 to 0.54 | −0.69 to 0.53 (agrees) |
| TFS p | Results, ITT para 2 | 0.81 | 0.80 from the arms; 0.81 from the CI (agrees) |
| TFS 95% CI | Abstract | −0.10 to 0.26 | should be −0.69 to 0.54. The stated interval has midpoint +0.08 and implied SE 0.092 |
| Position of −0.07 in the abstract CI | Abstract | — | 0.03 above the lower bound and 0.33 below the upper bound. The midpoint is 0.15 above the estimate |
| TFS p | Abstract | 0.37 | should be 0.81. The abstract CI implies p = 0.38 for +0.08, and p = 0.45 for the stated −0.07 |
| Estimate that p = 0.37 would need at SE 0.311 | Abstract | — | about ±0.28 (|z| = 0.896) |
| Per-arm SE needed to produce the abstract CI | Abstract | — | 0.065; the Results give 0.22 |
| Ratio of CI widths, Results / abstract | — | — | 3.4 |
| Most Bothersome Symptom difference | eTable 1 | 0.08 (‒0.10, 0.26); p 0.37 | +0.08 from −0.21 − (−0.29); SE 0.085; CI −0.09 to 0.25; p 0.35 (agrees) |
| Abstract TFS CI and p vs eTable 1 MBS CI and p | Abstract, eTable 1 | −0.10 to 0.26, p 0.37 in both | identical |
| TFS per-protocol | Results | 0.09 (−0.54 to 0.72); p 0.78 | p 0.78 (agrees); does not match the abstract |
| TFS mtDNA subgroup | Results | −0.21 (−0.9 to 0.5); p 0.55 | p 0.56 (agrees); does not match the abstract |
| TFS nDNA subgroup | Results | 0.03; p 0.93 | +0.03, CI −0.65 to 0.71, p 0.93 (agrees); does not match the abstract |
| 6MWT ITT | Abstract and Results | −3.2 (−18.7 to 12.3); p 0.69 | −3.2, CI −19.0 to 12.6, p 0.69. Abstract and Results agree |
| Unadjusted week-24 TFS change (external) | ClinicalTrials.gov NCT03323749 | −1.18 (SD 2.132, n 98) vs −1.09 (SD 2.443, n 101) | difference −0.09, CI −0.73 to 0.55, Welch p 0.78. Supports the Results version |
The Results values for the TFS are internally consistent, and the abstract values are not. The abstract's interval and p-value fit together, since an estimate of +0.08 with SE 0.092 gives p ≈ 0.38. But they fit an estimate of +0.08, not the stated −0.07, and they need an SE about one third of the SE the arm statistics give. A difference of +0.08 on (−0.10, 0.26) with p = 0.37 is exactly what eTable 1 reports for the Most Bothersome Symptom score. That endpoint's arm SEs (0.06 each) reproduce the interval to within rounding.
Figure
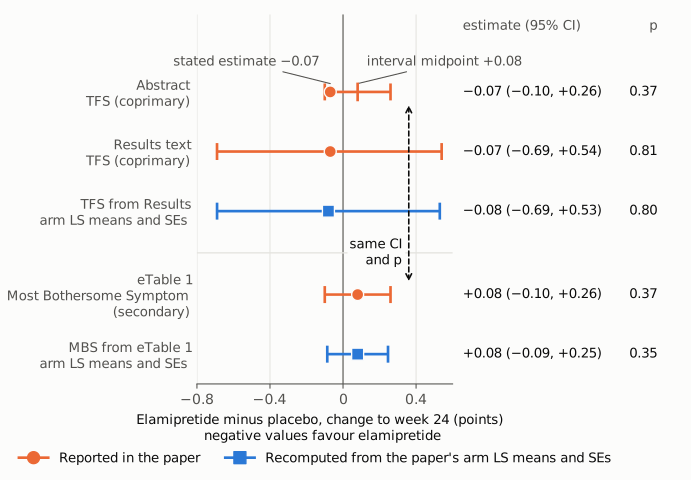
Figure 1. Between-group differences (elamipretide minus placebo) in change from baseline to week 24, with 95% confidence intervals, all on one points scale. Orange circles are values printed in the paper. Blue squares are values recomputed by recompute.py.txt from the arm LS means and SEs that the paper prints next to them. Top three rows: the coprimary PMMSA total fatigue score (TFS) as given in the abstract, as given in the Results text, and as recomputed. In the abstract row the stated estimate (−0.07) sits near the lower end of its interval, and a tick marks the interval's midpoint (+0.08). Bottom two rows: the secondary PMMSA Most Bothersome Symptom (MBS) score from supplementary eTable 1, as printed and as recomputed. The dashed connector joins the two rows whose 95% CI (−0.10 to 0.26) and p-value (0.37) are identical. The vertical line marks no difference. The right-hand columns give each estimate, its interval and its p-value.
Why it matters
- It is a coprimary endpoint, and the error is in the abstract. The TFS is one of the trial's two coprimary endpoints. Abstracts are what most readers, indexers and systematic reviewers extract. Anyone taking the abstract's interval would record a standard error of about 0.09 instead of about 0.31, which gives the trial about 11.5 times its actual weight in an inverse-variance meta-analysis ((0.311 / 0.092)² = 11.5).
- Precision is overstated, though the conclusion is not reversed. Both versions are non-significant and the direction of the estimate is the same. Under the Hochberg rule in the Methods, the smaller of the two coprimary p-values had to be ≤ 0.025. That is 0.37 with the abstract value and 0.69 with the Results values, so neither version changes the formal outcome. The abstract's interval would exclude any benefit larger than 0.10 points, while the correct interval extends to a 0.69-point benefit. The abstract therefore presents a much tighter null than the trial measured.
- It bears on the paper's own discussion. The Discussion says that participants given elamipretide "did report slightly less total fatigue" and that future studies should test whether this is a true effect. The correct, wider interval is compatible with that hypothesis to a degree that the abstract's interval is not.
Explanations considered
- A different analysis population for the TFS. This does not account for the numbers. The per-protocol TFS result (0.09; −0.54 to 0.72; p 0.78), the mtDNA subgroup (−0.21; −0.9 to 0.5; p 0.55) and the nDNA subgroup (0.03; p 0.93) all have intervals 3 to 4 times wider than the abstract's, and none has p = 0.37.
- A different model or adjustment for the same endpoint. This is unlikely. Any TFS analysis of these participants must reflect the observed spread of the TFS change. The posted ClinicalTrials.gov summary (SDs 2.13 and 2.44, n 98 and 101) gives an unadjusted SE of 0.325, close to the MMRM-based 0.311. Reaching SE 0.092 would require per-arm SEs of about 0.065 rather than 0.22, and nothing in the paper reports variability that small for the TFS.
- An asymmetric interval, for example from a transformation or bootstrap. This does not fit. The Results interval for the same contrast is symmetric about −0.075, so the model produces symmetric Wald-type intervals. An interval with its estimate 0.03 from one bound and 0.33 from the other would not come from the same method.
- A one-sided p-value or a per-item rescaling. Neither reproduces 0.37. Half of 0.81 is 0.405, and dividing the Results interval by the number of TFS items (4) gives −0.172 to 0.135, not −0.10 to 0.26.
- A conversion artefact in PMC. This is ruled out. The publisher's typeset PDF, the live PMC page and the Europe PMC full-text XML all give the same abstract values.
- Values carried over from the secondary Most Bothersome Symptom row of eTable 1. This accounts for every number. The abstract's CI (−0.10 to 0.26) and p (0.37) are identical to eTable 1's MBS values. The MBS estimate (0.08) is the exact midpoint of that interval, and the MBS arm SEs reproduce it (−0.09 to 0.25; p 0.35). The abstract kept the TFS point estimate (−0.07), which matches the Results. The paper does not say how the abstract values were produced. The match is identified here from the numbers alone.
Status
- Version of record. The neurology.org page returned HTTP 403. The publisher's typeset open-access PDF (Neurology 2023;101(3):e238–e252, 16 pages, as held in an institutional repository), the live PMC page and the Europe PMC full-text XML were read instead. All three carry the same abstract (−0.07; −0.10 to 0.26; p = 0.37) and Results (−0.07; −0.69 to 0.54; p = 0.81) values.
- Supplements. I downloaded and read eTable 1 (links.lww.com/WNL/C852, one page, "Secondary Endpoints Results at Week 24"). It holds the Most Bothersome Symptom row quoted above. eFigure 1 (links.lww.com/WNL/C851, genotype distribution) was also read and contains no TFS estimates. The coinvestigator list (C860) is not relevant.
- Trial registry. I read the ClinicalTrials.gov posted results for NCT03323749 (API v2). They give week-24 TFS change −1.18 (SD 2.132, n 98) for elamipretide and −1.09 (SD 2.443, n 101) for placebo.
- Corrections. I found no correction, erratum, retraction or expression of concern. Crossref has no update-to or updated-by relation, there are no PMC or Europe PMC notices (
src/known.py, rerun on 2026-10-24), and the PubMed record (PMID 37268435) lists no linked comments or errata. Web searches found no notice for this paper. The only elamipretide correction in Neurology concerns an earlier (2018) trial. - Post-publication discussion. A web search found no PubPeer thread or Retraction Watch entry. PubPeer's API required human verification, so its own search could not be run directly, and the Europe PMC search API was unavailable (HTTP 503) on three attempts.
- Status as of 2026-10-24.
Suggested correction
In the abstract's Results paragraph, replace
on the PMMSA, the total fatigue score was −0.07 (95% CI −0.10 to 0.26; p = 0.37)
with
on the PMMSA, the total fatigue score was −0.07 (95% CI −0.69 to 0.54; p = 0.81)
which matches the Results section, Figure 2B and the arm LS means and SEs (−1.13 ± 0.22 vs −1.05 ± 0.22). The authors should confirm these values against the MMRM output. No other sentence needs to change: the abstract's statements that the study did not meet its primary endpoints, and the Class I evidence statement, hold under the corrected values.