← Back to the plain-language case
Abstract says vitamin D3 rose in Scribble knockout mice; Results and Fig. 3E show a fall
Proc Natl Acad Sci U S A (2023) · doi:10.1073/pnas.2220851120 · PMC10266016
Summary
The abstract states that knocking out Scribble in renal proximal tubules "caused significant plasma phosphate elevation and increased aggregate vitamin D3 levels". The paper defines a single aggregate vitamin D3 measure: three metabolites, each normalized to littermate controls and then combined. Fig. 3E is the only place it is plotted. The Results text and the Fig. 3 legend both describe that measure as decreased, and the points plotted in Fig. 3E agree: digitized, the six tamoxifen-induced knockout values have a mean of 63.2% of control, and 5 of the 6 lie below 100%. Vitamin D is one of the two in vivo findings the abstract reports, so a reader of the abstract alone gets the direction of that finding reversed.
What the paper reports
Abstract (as archived in PMC, after the Significance statement):
The loss of Scribble impacted serum phosphate and vitamin D levels and caused significant plasma phosphate elevation and increased aggregate vitamin D3 levels, whereas blood glucose levels remained unchanged.
Results, section "Loss of Scribble Impacts Renal Phosphate Homeostasis and Serum Vitamin D Levels", second paragraph:
Combined 1,25(OH)2D3 + 24,25(OH)2D3 + 24(OH)D3 levels, as indicated in Methods, decreased only in Tam-injected animals and not in corresponding Cre littermates (Fig. 3E).
Fig. 3 legend:
(B) Targeted Scribble KO mice display increased serum phosphate (C), normal levels of calcium and glucose (D), decreased 1,25[OH]2-vitamin D (1,25[OH]2D) levels (E), and normal levels of PTH and FGF23 (F and G).
Materials and Methods, "Mice.", where the aggregate is defined:
Vitamin D3 was measured as described (52) on littermate pairs. 1,25 vitamin D3, 24,25 vitamin D3, and 25 vitamin D3 forms were normalized to control levels and combined.
Fig. 3E (an image; the axis title and group labels were read from the archived figure file pnas.2220851120fig03.jpg): the y-axis is "Plasma Vitamin D % control", the groups are Veh, Tam and Cre, and a bracket marks Veh vs Tam with "*" and Veh vs Cre with "ns".
Statements elsewhere that give no direction. Significance statement:
The loss of this interaction impacts serum phosphate and vitamin D levels in Scribble KO mice.
Discussion, second paragraph:
Targeted loss of Scribble in proximal tubules resulted in pronounced alterations to serum phosphate and vitamin D levels, whereas glucose, calcium, PTH and FGF23 levels remained unaffected.
Discussion, third paragraph, on mechanism:
PTHR activates the 25-hydroxyvitamin D3-1α-hydroxylase catalyzing the formation of biologically active 1,25(OH)2-vitamin D3.
What the paper's own numbers show
Method. The text gives no vitamin D values, means or test statistics, so the direction can be checked in two ways: by comparing what the text says in each place, and by reading the plotted points in Fig. 3E. For the second, I took the figure as archived in PMC and Europe PMC (708 × 927 px). I calibrated the y-axis from its five tick marks (0, 50, 100, 150 and 200%; largest residual 0.5 percentage points) and located each dot as the centroid of its connected block of dark pixels. As a check, the six Veh (control) dots, which are fixed at 100% by the normalization, come out at 99.8%. The mean computed from the digitized dots matches the mean bar drawn in the figure to within 0.7 percentage points for Tam and exactly for Cre. The paper does not say which test produced the "*". Because each knockout value is already a ratio to its own littermate control, a one-sample test against 100% is the natural analogue, and I report it only to show that the plotted points are consistent with the asterisk. Every number below is printed by recompute.py.txt.
| Quantity | Location | Reported | Recomputed from the paper's own figure |
|---|---|---|---|
| Direction of the aggregate vitamin D3 measure | Abstract | "increased" | decrease (opposite sign) |
| Direction of the same measure | Results, second paragraph | "decreased only in Tam-injected animals" | decrease (agrees) |
| Direction of panel E | Fig. 3 legend | "decreased … levels (E)" | decrease (agrees) |
| Control (Veh) dots | Fig. 3E | fixed at 100% | 99.8% (calibration check) |
| Tam (knockout) dots, % of control | Fig. 3E | plotted only | 109.2, 78.0, 55.8, 49.2, 44.0, 42.7 |
| Tam mean (median) | Fig. 3E | mean bar drawn, no value given | 63.2% (52.5%); drawn bar reads 62.5% |
| Change vs control | Fig. 3E | — | −36.8 percentage points |
| Tam dots below 100% | Fig. 3E | — | 5 of 6 |
| Tam 95% CI of the mean (t, df = 5) | Fig. 3E | — | 35.9% to 90.4%; excludes 100% |
| Test of Tam vs control | Fig. 3E | "*" | one-sample t = −3.47, two-sided p = 0.018; exact Wilcoxon p = 0.0625 |
| Cre-only littermates, % of control | Fig. 3E | "ns" | 150.8, 133.4, 126.0, 109.9, 78.5, 69.2; mean 111.3% (95% CI 77.8 to 144.9; p = 0.43) |
| Digitizing error needed to move the Tam mean to 100% | — | — | 21.9 px for every dot; a dot is about 5 px across |
The direction does not depend on how precisely the dots were located: every Tam dot would have to be misplaced by about four dot diameters for the mean to reach 100%. The only group whose mean lies above 100% is Cre, and that difference is marked "ns" and is not attributed to loss of Scribble.
Figure
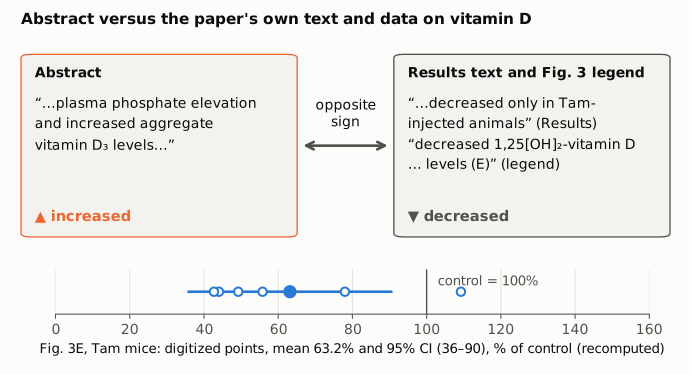
Figure 1. Top: the two text statements about the same aggregate vitamin D measure. The abstract (orange outline) says "increased"; the Results text and Fig. 3 legend (grey outline) say "decreased". Bottom: the six knockout (Tam) values read from Fig. 3E, as % of littermate control (open blue circles), with their mean of 63.2% (filled blue circle) and its t-based 95% interval of 35.9% to 90.4% (blue line); the vertical line marks the control level of 100%. Blue values are recomputed by recompute.py.txt from the paper's own figure; they are not values printed in the paper. The axis starts at zero.
Design candidates for review.
recompute.py.txtalso writes five candidate layouts of this figure,fig1_Atofig1_E(fig1 is currently design D). Only the chosen design will be kept as fig1.
Why it matters
- The abstract reverses one of its two in vivo findings. Plasma phosphate and vitamin D are the only in vivo results in the abstract. Many readers, indexers and citing authors see only the abstract, and from it they will take an increase in vitamin D3 that the paper's data do not show.
- The direction matters physiologically. High plasma phosphate with lower vitamin D metabolites and unchanged PTH and FGF23, which is what the Results and Fig. 3 report, fits reduced PTHR signaling in the proximal tubule. The paper's own Discussion notes that PTHR activates the 1α-hydroxylase that forms 1,25(OH)2D3. Higher vitamin D, as the abstract states, would point the other way.
- The overall conclusion is not affected. The paper's broader claim, that Scribble loss alters phosphate and vitamin D homeostasis, holds whichever way vitamin D moved. The error is in how the abstract describes the result, not in the data or the analysis.
Explanations considered
- A different vitamin D measure. Not supported. Methods define one aggregate ("normalized to control levels and combined"), Fig. 3E is the only vitamin D panel, and the SI Appendix (4 pages: Figs. S1–S2 and two movie legends) contains no vitamin D data. "Aggregate vitamin D3" in the abstract can only refer to the Fig. 3E measure, which the Results call "Combined" levels.
- A different comparison group. Not supported. The Cre-only littermates have a mean slightly above 100% (111.3%), but the figure marks that difference "ns", and the abstract attributes the change to "the loss of Scribble", which is the Tam group. The Results say the change occurred "only in Tam-injected animals and not in corresponding Cre littermates".
- An inverted scale, such as control divided by knockout. Not supported. The axis is "% control" with the controls fixed at 100, and both the Results and the legend use "decreased" for the same panel.
- A conversion or typesetting artifact. Not possible here. The conflict is between the words "increased" and "decreased", not a sign, superscript or digit. The Europe PMC full-text XML deposited for this article carries the same abstract, Results and legend wording.
- Digitizing error. Not able to explain it. The calibration reproduces the control row (99.8%) and both drawn mean bars, and a reversal would need every Tam dot to be misplaced by about 22 px.
- A correction already issued. None found (see Status).
- Side inconsistencies that do not change the direction. The Results name the third metabolite "24(OH)D3", while Methods list "25 vitamin D3". The legend calls panel E "1,25[OH]2-vitamin D" although the panel shows the combined measure. The legend's panel letters follow the items rather than preceding them ("(B) … increased serum phosphate (C)"), while the Results cite phosphate as Fig. 3B. Panel E is labelled as vitamin D in the figure itself, so none of these affects the direction.
Status
- Version of record. The publisher's page (pnas.org, reached through the DOI) returned HTTP 403 to automated requests. I checked the Europe PMC full-text XML deposited for the article, and its abstract, Results paragraph, Fig. 3 legend and Methods sentence match the PMC archive word for word. Every quotation above was checked verbatim against the PMC-archived text with
src/show.py. The Fig. 3E axis title, group labels and significance marks were read from the published figure image. - Supplements. I downloaded the Europe PMC supplementary bundle. It holds the SI Appendix (
pnas.2220851120.sapp.pdf, 4 pages), two molecular dynamics movies and the three main figure images. A text search of the SI Appendix finds "vitamin" only in the title and no vitamin D data. The Data Availability statement places all data in the article or SI, and there is no source-data file. - Corrections and comments. As of 2026-10-23 I found no correction, erratum, retraction or expression of concern.
src/known.pyreturns no Crossref update relations, no PMC notices and no Europe PMC notices. The Europe PMC record (PMID 37252981) lists no comments or corrections, and a Europe PMC search for an erratum on this title returned none. PubPeer's search page returned HTTP 403 and its API returned no record to automated requests. A web search for the title together with "PubPeer" found no thread for this article. - Sources. PMC article PMC10266016; Europe PMC full-text XML and supplementary files for PMC10266016; figure image
pnas.2220851120fig03.jpg; SI Appendixpnas.2220851120.sapp.pdf; Crossref; Europe PMC; PubPeer; https://doi.org/10.1073/pnas.2220851120.
Suggested correction
In the abstract, replace
caused significant plasma phosphate elevation and increased aggregate vitamin D3 levels
with
caused significant plasma phosphate elevation and decreased aggregate vitamin D3 levels
so that the abstract agrees with the Results text, the Fig. 3 legend and the data in Fig. 3E. The authors may also wish to make the third metabolite the same in Results ("24(OH)D3") and Methods ("25 vitamin D3"), to describe panel E in the legend as the combined measure, and to give the test used for Fig. 3E with its n and P value.