← Back to the plain-language case
Both all-cause hazard ratios lie outside their own 95% confidence intervals in abstract, text and table
Int J Epidemiol (2023) · doi:10.1093/ije/dyad006 · PMC10114125
Summary
The paper's headline result is the all-cause mortality hazard ratio (HR) versus housed patients. It is reported as HR 4.0 (95% CI 2.0–3.3) for homeless patients and HR 2.6 (95% CI 3.4–4.8) for marginally housed patients, with the same figures in the abstract, the Results text and Table 2. Neither point estimate lies inside its own interval, and rounding cannot close the gap. The geometric midpoint of each printed interval (2.57 and 4.04) matches the other group's HR, while all 14 cause-specific rows of Table 2 are centred on their own estimates to within 0.3%. The most likely explanation is that the two intervals were transposed. The direction and significance of the findings do not change, but the uncertainty printed for the main result is impossible as it stands, and the printed intervals reverse the ordering behind the paper's comparison of the two groups.
What the paper reports
Abstract, Findings (the unmatched bracket is in the original):
Data from 6290 patients (homeless deceased = 382/1050, marginally housed deceased = 259/518, housed deceased = 1204/4722) found increased risk of mortality in homeless [hazard ratio (HR) = 4.0, 95% confidence interval (CI) = 2.0–3.3) and marginally housed (HR = 2.6, 95% CI = 3.4–4.8) patients.
Results, all-cause mortality paragraph:
Risk of all-cause mortality over the 16-year follow-up period was increased for homeless (HR = 4.0, 95% CI = 2.0–3.3) and marginally housed (HR = 2.6, 95% CI = 3.4–4.8) patients after their index (first) 2003/04 ED presentation, compared with housed patients who presented for ED care during the same period (Table 2).
Table 2, "Estimated hazard ratios for all-cause and cause-specific deaths in homeless and marginally housed patients", header and All-causes rows (columns: Cox HR | FPNP HR | 95% CI | P-value):
Homeless | | 4.0 | 2.0–3.3 | <0.0001
Marginally housed | | 2.6 | 3.4–4.8 | <0.0001
Table 2 footer:
HR, hazard ratio; FPNP, flexible non-proportional parametric hazards model; CI, confidence interval.
Methods, Statistical analysis:
Hazard ratios (HRs) and 95% confidence intervals (CIs) were generated for homeless and marginally housed patients, with housed patients as the reference category. We assessed for violations of the proportionality assumption by calculating Schoenfeld residuals. If proportionality did not hold, flexible non-proportional parametric models were created using restricted cubic splines to incorporate time-dependent effects.
Abstract, Conclusions:
Marginal housing may assuage some risk of premature mortality associated with homelessness; however, it is not equivalent to stable housing.
What the paper's own numbers show
Method. A 95% confidence interval reported with a point estimate must contain that estimate. For ratio measures estimated on the log scale, which is the standard approach for Cox and flexible parametric survival models, the interval is also near-symmetric on the log scale, so the point estimate is close to the geometric midpoint √(L×U) of the limits. The implied standard error of ln HR is (ln U − ln L)/(2 × 1.96). I applied these checks to all 16 rows of Table 2 and then repeated them with the two all-cause intervals exchanged. All numbers below are printed by recompute.py.txt.
| Quantity | Location | Reported | Recomputed |
|---|---|---|---|
| Homeless all-cause HR inside its CI? | Abstract, Results, Table 2 | 4.0 (2.0–3.3) | No: 4.0 exceeds the upper limit by 0.7. Even at the rounding extremes (HR ≥ 3.95, upper < 3.35) the gap is ≥ 0.60 |
| Marginally housed all-cause HR inside its CI? | Abstract, Results, Table 2 | 2.6 (3.4–4.8) | No: 2.6 is 0.8 below the lower limit. At the rounding extremes the gap is ≥ 0.70 |
| Geometric midpoint of the homeless CI | Table 2 | 2.0–3.3 | √(2.0×3.3) = 2.57, which rounds to 2.6, the marginally housed HR |
| Geometric midpoint of the marginally housed CI | Table 2 | 3.4–4.8 | √(3.4×4.8) = 4.04, which rounds to 4.0, the homeless HR |
| Printed HR ÷ √(L×U), all-cause rows | Table 2 | – | 1.56 (homeless), 0.64 (marginally housed) |
| Printed HR ÷ √(L×U), 14 cause-specific rows | Table 2 | e.g. 6.11 (4.47–8.35), 4.69 (1.82–12.05) | 0.997 to 1.003 for every row; all 14 contain their estimate |
| P-values recomputed from the cause-specific CIs (Wald, log scale) | Table 2 | 0.550, 0.004, 0.060, 0.194, <0.001; others <0.0001 | 0.55, 0.004, 0.060, 0.19, 0.0014; others < 0.0001. All agree to rounding except respiratory/marginally housed (<0.001 vs 0.0014), a small difference that may reflect a different test and does not concern the all-cause rows |
| Swap test: homeless HR 4.0 with CI 3.4–4.8 | derived | – | Contains 4.0; √(L×U) = 4.04; log-scale asymmetry +0.020 |
| Swap test: marginally housed HR 2.6 with CI 2.0–3.3 | derived | – | Contains 2.6; √(L×U) = 2.57; log-scale asymmetry −0.024 |
| Implied SE(ln HR), homeless / marginally housed | derived | – | As printed: 0.128 / 0.088 (ratio 1.45). After swap: 0.088 / 0.128 (ratio 0.69) |
| Rough SE(ln HR) from death counts, √(1/d₁ + 1/d₀) | Abstract counts | 382, 259 and 1204 deaths | 0.059 / 0.068 (ratio 0.86): the group with more deaths should have the narrower interval, which matches the swapped pairing, not the printed one. This is a crude approximation that ignores the time-varying FPNP model, so only the direction of the ratio is informative |
| Crude proportions dead | Abstract | 382/1050, 259/518, 1204/4722 | 0.364, 0.500, 0.255 (consistent with the counts; total 6290) |
Figure
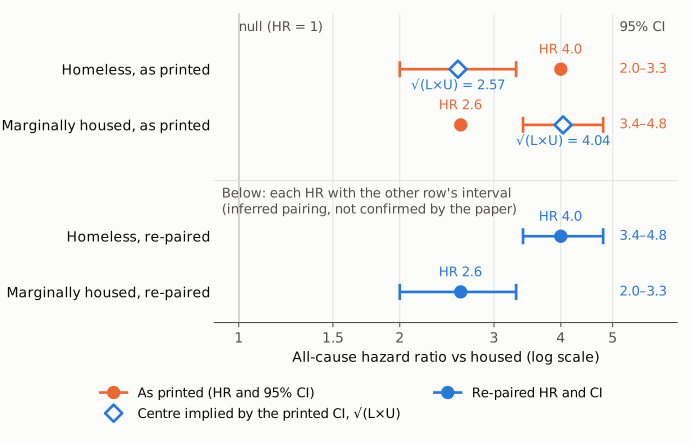
Figure 1. All-cause hazard ratios versus housed patients, on a log scale with the null (HR = 1) marked. Top two rows, in orange, show the values as printed in the abstract, the Results and Table 2. Each orange point lies outside its orange interval. The open blue diamonds mark the geometric midpoint √(L×U) of each printed interval, which is where a log-scale interval puts its point estimate: 2.57 for the homeless interval and 4.04 for the marginally housed interval, each matching the other group's printed HR. The bottom two rows, in blue, pair each printed HR with the other row's interval. Each interval then contains its estimate and is centred on it. This pairing is an inference from the paper's numbers and is not confirmed by the paper.
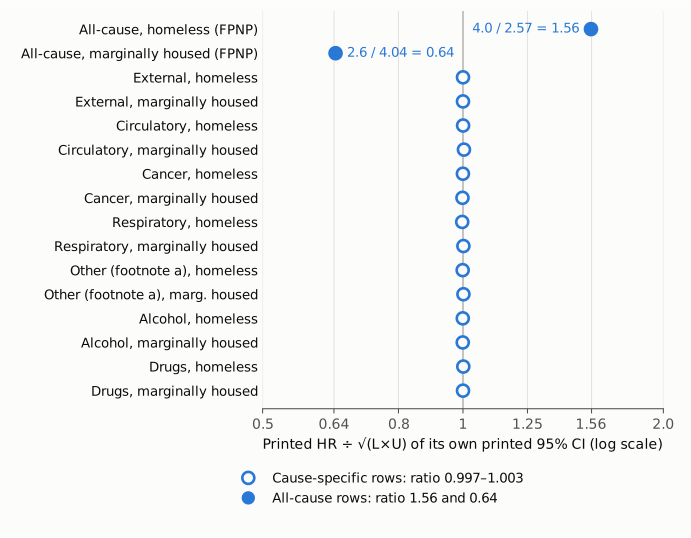
Figure 2. For every row of Table 2, the printed HR divided by the geometric midpoint of its own printed 95% CI, on a log scale. The 14 cause-specific rows (open circles) sit at 0.997–1.003, so the table's intervals follow the usual log-symmetric convention. Only the two all-cause rows (filled circles) depart from it, at 1.56 and 0.64, which are reciprocal deviations of about the same size. A systematic reporting convention would affect all rows, so this points to an error confined to the two all-cause rows.
Why it matters
- The all-cause HRs are the paper's primary result. The impossible intervals appear in the abstract, which is the part most often read, cited and indexed on its own, as well as in the Results text and Table 2. The Discussion repeats only the point estimates ("four times higher", "2.6 times greater"). The title and the Conclusions section do not quote the intervals.
- As printed, the homeless interval (2.0–3.3) lies entirely below the marginally housed interval (3.4–4.8). Taken at face value, that would mean marginally housed patients had significantly higher all-cause hazard than homeless patients. This is the opposite of the paper's conclusion that "Marginal housing may assuage some risk of premature mortality associated with homelessness". Under the swapped pairing, the ordering agrees with the point estimates and with that conclusion.
- Readers who extract these estimates for meta-analysis would enter either an impossible pair or an interval that belongs to the other group. A pooled analysis that derives standard errors from the printed limits would give the homeless estimate the wider interval and the marginally housed estimate the narrower one.
- Unaffected: the direction and statistical significance of both all-cause associations (every candidate interval excludes 1), the point estimates themselves, all cause-specific HRs, the cumulative incidence probabilities of death by age 55 (0.2, 0.1 and 0.02), and the crude death counts.
Explanations considered
- Non-proportional (FPNP) model. The all-cause estimates come from the flexible non-proportional parametric model, not from Cox regression. This does not explain the mismatch. Whatever model produced it, a 95% CI reported with a point estimate must contain that estimate. If a time-varying HR is summarised at one time point or averaged, its interval is computed for the same summary. Three other rows in Table 2 (circulatory, respiratory and the footnote-a category) are also FPNP estimates, and all of them are centred on their point estimates.
- The intervals refer to a different quantity (another time point, an adjusted model or another reference group). The Methods describe one unadjusted model per outcome with housed patients as the reference. Neither the table footnote nor the text says the all-cause intervals refer to anything else. The abstract and the Results text present each interval in parentheses directly after its HR.
- Rounding. The HRs and limits are given to one decimal. At the most favourable rounding extremes, the gaps are still at least 0.60 (homeless) and 0.70 (marginally housed), so rounding cannot account for them.
- Unit or scale mix-up. Every other row of Table 2 is on the ratio scale and internally consistent (Figure 2), and both all-cause intervals are plausible ratio-scale intervals. They simply sit on the wrong rows.
- Conversion or typesetting artifact in PMC. The same values appear in the publisher's HTML, the PMC HTML and the Europe PMC full-text XML, where each HR and its CI are in adjacent cells of the same table row. The same pairs also appear in two prose passages, so a table-rendering fault in one version cannot explain them.
- Clarified in the supplement. The supplementary file covers housing definitions, inter-rater reliability, sampling, ICD-10 groupings and a linkage flow chart. It contains no hazard ratios or model output.
None of these accounts for the numbers. Exchanging the two intervals between the rows explains every observation: containment, log-symmetry, and the ordering of interval widths by number of deaths. However, only the authors' model output can confirm what the correct intervals are.
Status
As of 2026-10-24:
- Version of record. The publisher's HTML (doi.org/10.1093/ije/dyad006, which resolves to academic.oup.com/ije/article/52/2/501/7031336) gives the same values in the abstract, the Results and Table 2. So do the PMC HTML, the Europe PMC full-text XML and the local PMC archive copy. The publisher PDF could not be retrieved (the download returned a block page).
- Supplement. dyad006_supplementary_data.docx, obtained through the Europe PMC supplementary-files archive, was read in full. It does not report hazard ratios and does not resolve the discrepancy.
- Corrections.
- Crossref has no update-to, updated-by or relation entries for the DOI.
- PMC and Europe PMC correction/retraction notice queries returned nothing (re-checked on 2026-10-24).
- A Crossref bibliographic search for a "Correction to" notice under the publisher prefix found only the original article.
- Neither the publisher page nor the PMC page shows a correction notice.
- Web searches found no erratum and no Retraction Watch coverage.
- The Europe PMC search endpoint returned errors on three attempts, so its commentCorrectionList could not be checked directly.
- PubPeer. The API and search page did not return parseable results, so the PubPeer check is inconclusive.
Suggested correction
In the abstract, the Results (all-cause mortality paragraph) and Table 2 (All-causes rows), state the correct 95% confidence interval for each all-cause hazard ratio from the FPNP model output. If, as the paper's own numbers suggest, the intervals were exchanged between rows, the corrected values would read: homeless HR 4.0 (95% CI 3.4–4.8) and marginally housed HR 2.6 (95% CI 2.0–3.3). Both P-values (<0.0001) and all cause-specific estimates would stay as they are. A short correction notice linked to the article would let readers and meta-analysts who have already extracted the printed intervals update them. The unmatched bracket in the abstract ("[hazard ratio (HR) = 4.0, 95% confidence interval (CI) = 2.0–3.3)") could be fixed at the same time.