← Back to the plain-language case
Abstract and Table 1 report mean perivascular flow rate ten times below the per-mouse values' mean
Proc Natl Acad Sci U S A (2023) · doi:10.1073/pnas.2217744120 · PMC10083563
Summary
The abstract and the summary rows of Table 1 give the volume flow rate in the perivascular spaces of N = 4 mice as 2.22 ± 1.983 × 103 µm3/s. The four per-mouse values in the same table (2.18 × 10⁴, 5.02 × 10⁴, 1.13 × 10⁴ and 5.57 × 103 µm3/s) have a mean of 2.222 × 10⁴ and a sample SD of 1.983 × 104 µm3/s. The mantissas match exactly and only the power of ten differs, so the printed mean and spread are each ten times too small. The printed mean is also 2.5 times smaller than the smallest of the four values it averages. Flow rate is one of the four headline quantities in the abstract, and the paper offers these numbers as "immediately useful in modeling". The per-mouse values and the Discussion's whole-brain estimate are on the correct 104 scale.
What the paper reports
The PMC text flattens superscripts ("× 10 4"); below they are written as superscripts, as in the Europe PMC JATS markup and the typeset PDF. Wording is otherwise verbatim.
Abstract, last part:
In PVSs of N = 4 wild-type mice we find mean flow speed 16.33 ± 11.09 µm/s, volume flow rate 2.22 ± 1.983 × 103 µm3/s, axial pressure gradient ( - 2.75 ± 2.01)×10-4 Pa/µm (-2.07 ± 1.51 mmHg/m), and wall shear stress (3.00 ± 1.45)×10-3 Pa (all mean ± SE).
Table 1, "Quantities of interest for each mouse", excerpt of the Mouse and Q (µm3/s) columns:
1 | 2.18 × 10⁴
2 | 5.02 × 10⁴
3 | 1.13 × 10⁴
4 | 5.57 × 10³
mean | 2.22 × 10³
σ | 1.983 × 10³
Table 1 footer:
All values except the shear rate are temporally and spatially averaged. The shear rate is the median of all points in time and space. The values reported for mouse 1 are the average of the predictions from G1 to G6.
Results, section "Volume Flow Rate":
Among N = 4 mice, the time-averaged volume flow rate at the inlet ranged from 0.5 to 5 × 104 µm3/s, and the difference between the time-averaged flow rates at inlet and outlet ranged from -12 to 33%, as reported in Table 1.
Discussion, fourth paragraph:
Using AIV, we infer a volume flow rate of around 2.25 × 104 µm3/s (or 1.35 × 10⁻³ µL/min) in one side of the pial PVS in the territory of the middle cerebral artery of mouse 1.
This half of the PVS has a cross-sectional area of 1.1 × 103 µm2. Ray et al. estimate that the total periarterial cross-sectional area in the murine brain is 0.2 mm2, or approximately 182 times larger than the section we measured (5). If we assume that the flow rate in the section we measure is typical, we can approximate a total PVS flow rate of 0.25 µL/min, or 0.625 µL/(g-min) for a 0.4-g mouse brain, which agrees well with the estimates of 0.5µL/(g-min) inflow in mice from Ray et al. (5).
Discussion, last paragraph:
These numbers are immediately useful in modeling flow in PVSs
What the paper's own numbers show
Method. I took the four per-mouse rows of Table 1 and recomputed the mean and spread of every column, then compared them with the printed "mean" and "σ" rows. I also checked that the per-mouse Q values are really in µm3/s, in two ways that use other columns of the same table: dividing Q by the mean flow speed Q/A gives the cross-sectional area, and dividing the pressure gradient by Q gives the hydraulic resistance R. Every number below is printed by recompute.py.txt.
| Quantity | Location | Reported | Recomputed from the paper's own numbers |
|---|---|---|---|
| Mean volume flow rate Q, N = 4 | Table 1 mean row; Abstract | 2.22 × 103 µm3/s | 2.222 × 104 µm3/s (sum 88,870 ÷ 4 = 22,217.5); ratio 10.01 |
| Spread of Q | Table 1 σ row; Abstract | 1.983 × 103 µm3/s | 1.983 × 10⁴ (sample SD, n − 1); ratio 10.00 |
| SE of Q, if "SE" is meant | Abstract "(all mean ± SE)" | 1.983 × 10³ | 9.91 × 10³ (SD ÷ √4) |
| Smallest and largest per-mouse Q | Table 1 rows | 5.57 × 10³ and 5.02 × 10⁴ | the printed mean is 0.40 times the smallest value |
| Range of inlet Q | Results, "Volume Flow Rate" | 0.5 to 5 × 104 µm3/s | recomputed mean lies inside it; printed mean lies below it |
| Mouse 1 Q | Discussion vs Table 1 | 2.25 × 10⁴ (= 1.35 × 10⁻³ µL/min) vs 2.18 × 10⁴ | 2.25 × 104 µm3/s = 1.35 × 10⁻³ µL/min; same scale |
| Implied cross-section Q ÷ (Q/A) | Table 1; Discussion gives 1.1 × 103 µm2 | — | 1082, 1674, 1089, 1160 µm2 |
| R = |∂P/∂n| ÷ Q | Table 1 R column | 2.49 × 10⁻⁸, 6.47 × 10⁻⁹, 1.51 × 10⁻⁸, 1.30 × 10⁻⁸ | 2.45 × 10⁻⁸, 6.47 × 10⁻⁹, 1.50 × 10⁻⁸, 1.30 × 10⁻⁸ |
| Mean ± σ of the other columns | Table 1 mean and σ rows | e.g. Q/A 16.33 ± 11.09; ∂P/∂n −2.75 ± 2.01 × 10⁻⁴; R 1.49 × 10⁻⁸ ± 7.63 × 10⁻⁹; wall shear stress 3.00 ± 1.45 × 10⁻³ | all agree with the plain mean and sample SD of the four rows (e.g. 16.33 ± 11.09; −2.754 ± 2.013 × 10⁻⁴; 1.487 × 10⁻⁸ ± 7.63 × 10⁻⁹; 2.998 ± 1.453 × 10⁻³) |
The per-mouse Q values are self-consistent in µm3/s: the implied cross-sections of about 1.1 to 1.7 × 103 µm2 match the area the Discussion gives for mouse 1, and dividing the pressure gradient by Q reproduces the tabulated resistances to within 1.6%. The Q column is the only one whose summary rows disagree with its own entries, and the disagreement is exactly one power of ten in both rows. A mean of four positive values cannot be smaller than the smallest of them, so the printed 2.22 × 10³ cannot be the mean of the printed rows.
Figure
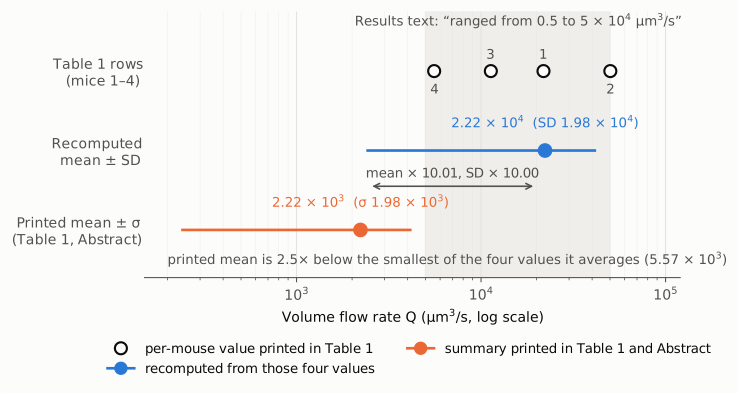
Figure 1. Volume flow rate on a log scale. Top row: the four per-mouse values printed in Table 1 (open black circles, numbered by mouse); the grey band is the range stated in the Results text (0.5 to 5 × 104 µm3/s). Middle row (blue): the mean ± sample SD recomputed from those four values, 2.222 × 10⁴ ± 1.983 × 104 µm3/s. Bottom row (orange): the mean ± σ printed in Table 1 and the abstract, 2.22 × 10³ ± 1.983 × 103 µm3/s. The printed summary is shifted by a factor of 10.0 from the recomputed one and lies outside the range of its own inputs. The log scale is used because the error is a ratio; it does not exaggerate the difference.
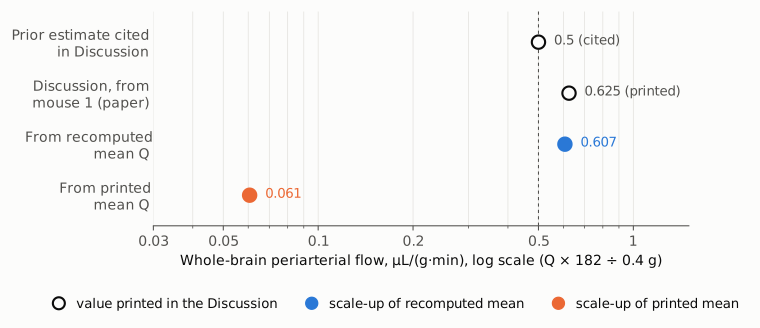
Figure 2. The Discussion's scale-up (Q × 182 for total periarterial area, ÷ 0.4 g brain mass) applied to each value, in µL/(g·min) on a log scale. Open black circles are numbers printed in the Discussion: the cited prior estimate of 0.5 (dashed line) and the paper's own 0.625, which it derived from mouse 1. Applied to the recomputed mean (blue) the scale-up gives 0.607; applied to the printed mean (orange) it gives 0.061, about one-eighth of the prior estimate. The Discussion used mouse 1, not the mean, so its conclusion stands; the figure shows only that the abstract value, taken at face value, would not support it.
Why it matters
- A headline number is wrong by a factor of 10. Flow rate is one of four quantities the abstract reports for the N = 4 mice, and the paper describes these numbers as "immediately useful in modeling flow in PVSs". A reader or modeler who takes the mean from the abstract or from the Table 1 summary row gets a perivascular flow rate, and its spread, ten times too small.
- The printed value contradicts the paper's own comparison with prior work. The abstract says "Pressure gradients, flow rates, and resistances agree with prior predictions." The correct mean scales up to about 0.24 µL/min, or 0.61 µL/(g·min), close to the cited prior 0.5 µL/(g·min). The printed mean would scale up to about 0.024 µL/min, or 0.061 µL/(g·min) (Figure 2).
- The analysis itself is not affected. The per-mouse flow rates, the Results range, the Discussion's whole-brain estimate (0.25 µL/min, 0.625 µL/(g·min)), the hydraulic resistances (which reproduce from the per-mouse Q values) and the validation of the method were all computed on the correct 104 scale. No statistical test depends on the mean flow rate. The error is confined to the reported summary statistic.
- The dispersion label is also inaccurate. The abstract labels all four ± values "mean ± SE", but each equals the sample SD of the four mice (for example 11.09 for flow speed). The SEs would be half as large (5.55 µm/s for flow speed and 0.99 × 104 µm3/s for flow rate). Table 1 labels the same row "σ", which fits an SD.
Explanations considered
- A different unit for the summary rows. Not supported. The Q column header is µm3/s and covers every row, including mean and σ. No conversion factor of exactly 10 links any plausible pair of volume-flow units.
- The per-mouse values, not the mean, are the ones in error. Not supported. The per-mouse values agree with three independent statements in the paper: the Results range (0.5 to 5 × 10⁴), the Discussion's mouse 1 value (2.25 × 104 µm3/s, which the paper converts correctly to 1.35 × 10⁻³ µL/min), and the Discussion's half-PVS area (1.1 × 103 µm2, matching Q ÷ (Q/A)). They also reproduce the tabulated resistances R = |∂P/∂n| ÷ Q.
- A different population, subset or statistic. Not supported. The footer describes only spatial and temporal averaging and how mouse 1 is formed from G1 to G6. Every other column's mean and σ rows equal the plain mean and sample SD of the same four rows, and the Q mantissas (2.222 and 1.983) match the recomputed mean and SD exactly. Only the exponent differs.
- Population SD, SE or another spread measure. Not able to explain it. The population SD (n) of Q is 1.717 × 10⁴ and the SE is 9.91 × 10³; neither gives 1.983 × 10³. Only the sample SD divided by exactly 10 does.
- A text-conversion or typesetting artifact. Ruled out. In the typeset PNAS PDF (text spans read with PyMuPDF), the exponent after "1.983 × 10" in the abstract and after "2.22 × 10" and "1.983 × 10" in the Table 1 summary rows is a superscript "3", while the rows for mice 1 to 3 carry a superscript "4". The Europe PMC JATS XML has the same markup (
10<sup>3</sup>), and the PMC HTML page shows the same values. - A correction already issued. None found (see Status).
- Side observation, not part of the main finding. For mouse 3, the pressure gradient −1.70 × 10⁻⁴ Pa/µm converts to −1.275 mmHg/m, while Table 1 gives −1.23 (a 3.7% difference; the other three mice agree within 0.4%). The printed mmHg/m mean and σ (−2.07, 1.51) equal the converted Pa/µm mean and SD (−2.066, 1.510) rather than the mean of the mmHg/m column (−2.059, 1.524). These differences are small and do not affect any conclusion.
Status
- Version of record. The publisher's page (pnas.org, reached through doi.org) returned HTTP 403 to automated requests. I checked three other copies of the published text. (1) The typeset PNAS PDF, whose metadata identifies it as Proc. Natl. Acad. Sci. U.S.A. 2023, 120:e2217744120, as hosted on the corresponding laboratory's website: the abstract (p. 1), Table 1 (p. 5) and Discussion (p. 7) carry the exponents described above. (2) The Europe PMC full-text JATS XML. (3) The PMC HTML page. All three agree with the passages quoted here. Every quotation was checked verbatim against the PMC-archived text with
src/show.py. - Supplements. The SI Appendix (
pnas.2217744120.sapp.pdf, 18 pages, from the Europe PMC supplementary bundle, which also holds Movies S1–S5) has no per-mouse or mean flow-rate table; it covers methods, Reynolds and Womersley estimates and validation errors. The data record cited in the Data Availability statement (Zenodo 7723381) holds raw imaging and geometry for mouse 1 only, and cannot bear on a four-mouse mean, which is in any case fully determined by the four values printed in Table 1. - Corrections and comments. As of 2026-10-24 I found no correction, erratum, retraction or expression of concern.
src/known.pyreturns no Crossref update relations, no PMC notices and no Europe PMC notices. The Crossref record has empty update-to and updated-by fields, and the PubMed record (PMID 36989300) has no CommentsCorrections entries. A Crossref search for a correction notice with this title found none. The PubPeer API returned no record (HTTP 404) to an automated DOI query, and a web search for the title together with "PubPeer" found no thread for this article. - Sources. PMC article PMC10083563; Europe PMC full-text XML and supplementary files for PMC10083563; typeset PNAS PDF; SI Appendix
pnas.2217744120.sapp.pdf; Zenodo record 7723381; Crossref; PubMed; Europe PMC; PubPeer; https://doi.org/10.1073/pnas.2217744120.
Suggested correction
In the abstract, replace
volume flow rate 2.22 ± 1.983 × 103 µm3/s
with
volume flow rate 2.22 ± 1.983 × 104 µm3/s
and in Table 1, change the Q entries of the mean row from 2.22 × 10³ to 2.22 × 10⁴ and of the σ row from 1.983 × 10³ to 1.983 × 10⁴. The authors may also wish to change "(all mean ± SE)" in the abstract to "(all mean ± SD)", since every ± value there equals the sample SD of the four mice. Alternatively they could report SEs, which for N = 4 are half the SDs (for flow rate, 0.99 × 104 µm3/s). They may also wish to check the mmHg/m entry for mouse 3 (−1.23) against its Pa/µm value (−1.70 × 10⁻⁴, which converts to −1.28).